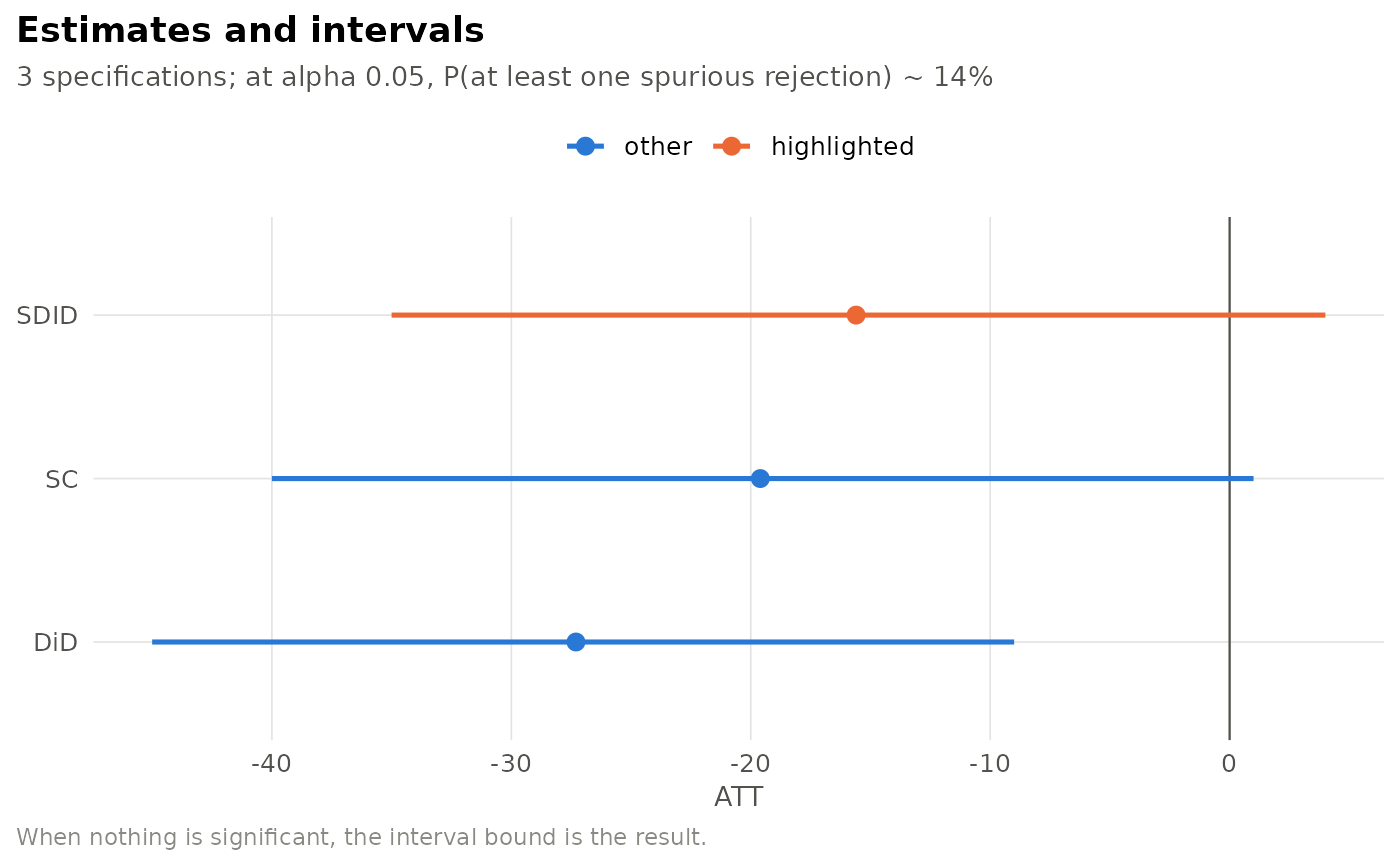
Forest plot of several estimates
Usage
plot_att_forest(
  df,
  highlight = NULL,
  sort_by = c("none", "att", "label"),
  xlab = "ATT"
)
Arguments
- df
A data frame with
label,att,ci_loandci_hicolumns, such assdid_results_table()output renamed, or built by hand.- highlight
Labels to draw in the highlight colour, e.g. the pre-specified primary estimate.
- sort_by
"none"(input order),"att"or"label".- xlab
Axis label.
Examples
plot_att_forest(data.frame(label = c("SDID", "SC", "DiD"), att = c(-15.6, -19.6, -27.3),
                           ci_lo = c(-35, -40, -45), ci_hi = c(4, 1, -9)),
                highlight = "SDID")